Well-Child Visits
Well-child visits are a key factor in children’s positive health and development. Regular check-ups with a primary care physician give children access to preventive services like immunizations and screenings and provide caregivers with guidance and education about developmental markers and home care. The American Academy of Pediatrics recommends annual well-child visits for children ages 3 to 6 years. Adherence to these guidelines can decrease adverse outcomes associated with health problems and can increase children’s long-term health and well-being. For this reason, data on the rate of well-child visits across the region can provide important insights into the potential for current and future health disparities among our region’s children.
The rate of well-child visits can also be an indicator of access to medical care. An analysis of national survey data by the Children’s Data Bank found that in 2011, “children under the age of six without health insurance coverage were significantly less likely than children with coverage to have received a well-child check-up in the past year (68 versus 90 percent, respectively). Of those who had health insurance, children covered by public health insurance were less likely to have received a well-child visit than those with private insurance (87 and 93 percent, respectively).”
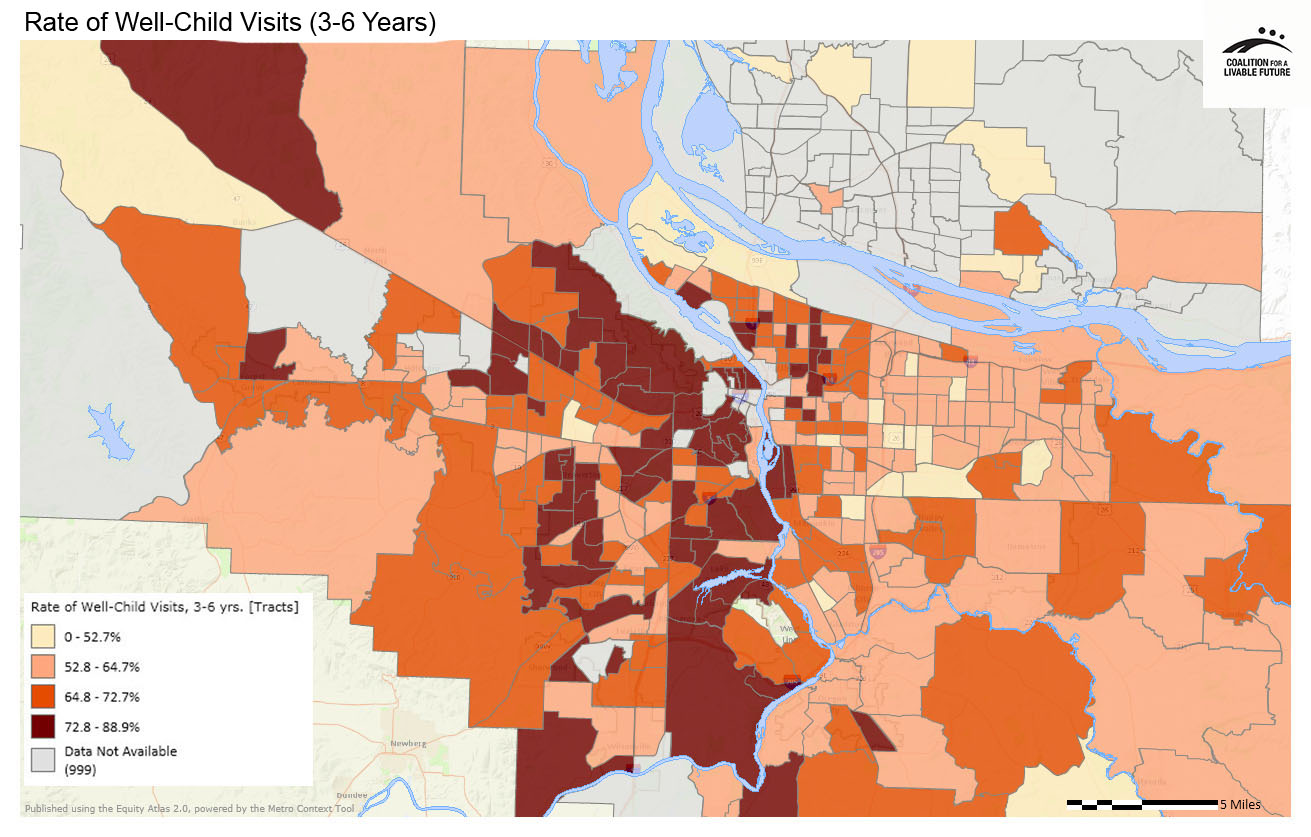
The Rate of Well-Child Visits map shows the percentage of children ages 3 to 6 years in each census tract who received a well-child visit during the previous year. It is based on patient-level insurance claims records data submitted to the Oregon Health Care Quality Corporation. The map documents geographic variations in the rate of well-child visits, providing important insights into potential disparities in access to preventive care for children. However, in light of the national research indicating that children without health insurance are less likely to receive preventive care than those with insurance, the map likely under-represents the full extent of the problem because it only includes data on children with insurance coverage.

What the Maps Tell Us: Initial Findings
Note: Although the Rate of Well-Child Visits map includes data for some Clark County census tracts, these data should be used with caution. The Oregon Health Care Quality Corporation collects insurance claims data for health plans operating in Oregon. Some of the participating health plans submit claims data for members living in Clark County, but many do not. For this reason the Clark County data are based on a limited population of Clark County residents and may not be representative of the entire population. The analysis of the patterns in the map will therefore focus only on the portions of the region located in Oregon.
The most striking pattern in the Rate of Well-Child Visits (3-6 Years) map is that the census tracts with the highest rates of well-child visits are almost all concentrated in a relatively narrow swath running from north to south in the center of the region. The exceptions are a large census tract on the northwestern edge of unincorporated Washington County, a smaller census tract that overlaps the northern edge of Forest Grove, and a census tract located in the southeastern portion of Oregon City.
The census tracts with the lowest rates of well-child visits are scattered throughout the region. They include several census tracts located in outer east Portland and Gresham, a large census tract in unincorporated western Washington County, several census tracts located in and adjacent to Beaverton, and several census tracts in north Portland, located in the St. Johns, Kenton, and East Columbia neighborhoods.
Even though the data underlying these maps do not include uninsured children, the patterns in the maps suggest a fairly strong correlation between income levels and the rate of well-child visits. Most of the census tracts with the highest well-child visit rates have median incomes that are above the regional average. Conversely, many census tracts with the lowest well-child visit rates have populations in poverty that are above the regional average. This pattern is most consistent in the region’s urbanized areas, whereas many of the census tracts in unincorporated parts of the region have low well-child visit rates along with poverty rates that are below the regional average. In those census tracts, lack of proximity to appropriate medical care may account for the lower rates of well-child visits.
About the Maps
Rate of Well-Child Visits (3-6 Years)
This map shows the percentage of children 3-6 years of age who received one or more well-child visits with a primary care provider during the measurement year by census tract. These data are compiled from insurance claims data submitted to the Oregon Health Care Quality Corporation, including administrative claims (billing) data from seven commercial health plans, two Medicaid managed care plans and the Oregon Health Authority Division of Medical Assistance Programs (Medicaid). Data are reported only for those patients that were continuously enrolled in a health plan that participates in the Oregon Health Care Quality Corporation’s measurement and reporting initiative or Medicaid fee-for-service during the measurement year. This means that they do not represent all persons living within a census tract. Data on well-child visits were geocoded by patient address and aggregated into census tracts in order to maintain confidentiality.
The data for this indicator do not include data on well-child visits for children who are uninsured, pay for their own health care services, or are covered by a plan or Medicaid provider that does not supply data to Oregon Healthcare Quality Corporation.
Data Source: Oregon Health Care Quality Corporation, 2011
|
This document was downloaded from the Map Series library of the Coalition for a Livable Future’s Regional Equity Atlas 2.0 website. The Regional Equity Atlas is a research and education project to promote widespread opportunity for a stronger, healthier, and more sustainable Portland-Vancouver metropolitan region. For more information, visit www.equityatlas.org. |
