|
|
|
|
|
An equitable region includes a mix of housing options that meet the entire population’s housing needs. This includes housing that is physically accessible for those with impaired mobility, including senior citizens and people with disabilities. This issue is increasingly important in light of the anticipated “graying” of our population as the baby boomer generation reaches retirement age.
Unfortunately, comprehensive data are not available on the physical accessibility of the region’s housing supply. In an effort to map this issue, the Atlas uses a proxy measure, based on the estimated locations of single story housing and elevator buildings. This proxy has limitations, but it offers an initial look at the distribution of housing that is likely to be physically accessible for seniors and people with physical disabilities.
This map series includes a map showing the density of single-story housing and elevator buildings and a map that layers this information with the census tracts with above the regional average percent population of seniors.

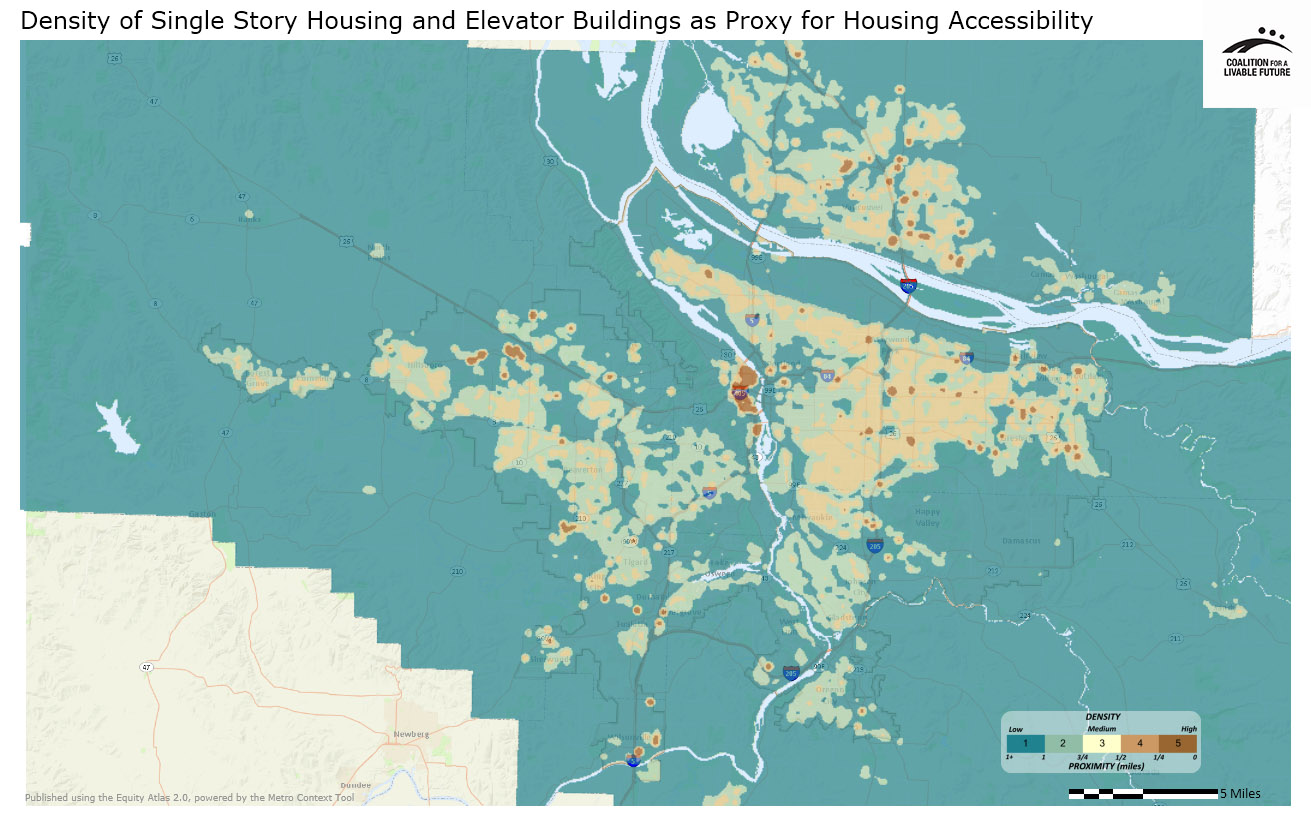
The Density of Single Story Housing and Elevator Buildings map indicates that the region’s highest density area of housing units in single story or elevator buildings is located in the Pearl District and downtown Portland. Smaller clusters occur in eastern Hillsboro, Tualatin, Gresham, Troutdale, Fairview, King City, Wilsonville, Vancouver and Beaverton.
The Density of Single Story Housing and Elevator Buildings in Relationship to Areas with Above Regional Average Percent Seniors (Ages 65+) map compares the locations of accessible housing units to the locations of census tracts with above average percentages of older adults. Surprisingly, many of the areas with the highest densities of accessible housing are not located in these older-adult census tracts. The primary example of this is the accessible housing hotspot located in the Pearl District and downtown Portland. Only a small portion of this hotspot is located in an older-adult census tract. Similar mismatches occur in Hillsboro, Vancouver, and east Multnomah County.
There are many possible explanations for this outcome besides a true mismatch between the locations of accessible housing and where older adults live. For example, there may be accessible homes and elevator buildings that were not captured in the data due to the methodology used. The outcome may also result from how the census tract boundaries are drawn relative to the actual locations of where seniors live. For example, there may be high densities of seniors in specific locations within a given census tract, but those densities may be masked when their data are averaged with the data from the rest of the census tract. Similarly, there may be a large population of people who are age 65 or older in a given census tract, but, because the overall population density is high, the share of older adults may not be as great as that of other census tracts with fewer residents overall.
The need for physically accessible housing is not limited to older adults; people of all ages who have mobility challenges need physically accessible housing. Unfortunately, the American Community Survey data about people with physical disabilities is not fine-grained enough to permit inclusion in this map series because the sample sizes at the census tract level are too small, and the resulting data have too high a margin of error to be reliable.
What these maps show most clearly is the need for better data about the location of accessible housing and its level and type of accessibility. For example, a single-story home is not truly accessible if there are multiple steps without a hand railing leading up to the front door, or if the doorway is not wide enough to accommodate a wheelchair. On the other hand, a two-story home could have an accessible first floor and be a suitable home for a household with a family member in a wheelchair. At present, these data are not collected in a systematic way at a regional scale. If our region is going to more equitably address the housing needs of seniors and people with physical disabilities, having more complete data on the availability of accessible housing is an essential first step.
This map shows the density of housing units that have either only one floor or elevator access to the upper stories (units per acre). These data are being used as a proxy for housing accessibility for persons with physical disabilities. The methodology used to determine both the single-story status and elevator accessibility for tax lots relied on estimates because comprehensive data are not available on these factors. Single-story status was estimated based on building heights for single-family homes while elevator accessibility was estimated based on the age of multi-story residential buildings. For more information on the methodology, see the Equity Atlas metadata.
Data Source: Metro analysis of RLIS data (for Clackamas, Washington and Multnomah counties) and Clark County GIS taxlot data (for Clark County) (2012)
This map layers the census tracts where the percent of the population that is age 65 or older is above the regional average on top of the Density of Single Story Housing and Elevator Buildings map.
Data Source: U.S. Census (2010); Metro analysis of RLIS data (for Clackamas, Washington and Multnomah counties) and Clark County GIS taxlot data (for Clark County) (2012)